Importance of Gantt Charts
Get to know the benefits of Gantt charts in project management and how it is useful for project managers.
#1
Plan, organize, track all your projects in one place
#2
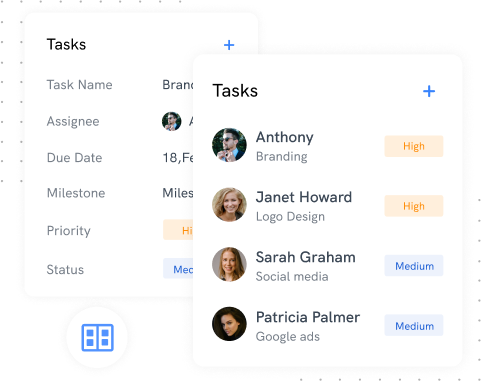
Get a visibility over individual tasks in the form of kanban boards
#3
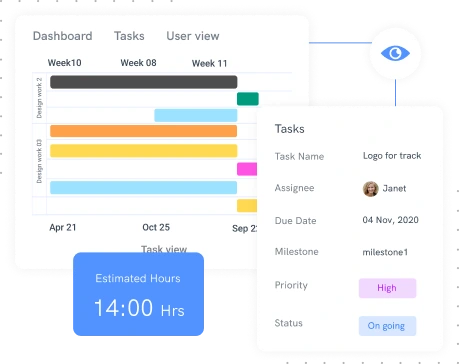
Track the project schedule using gantt chart and calendar view
#4
Create advanced workflows with powerful automations
#5
Track employee activities, and working hours using built-in time tracking software, Clockly
#6
Monitor activities using screen recorder on Windows, Mac and Linux devices
#7
Set S.M.A.R.T goals and achieve results
#8
Share files and collaborate with team through discussion boards
#9
Unbelievable pricing - the lowest you will ever find
#10
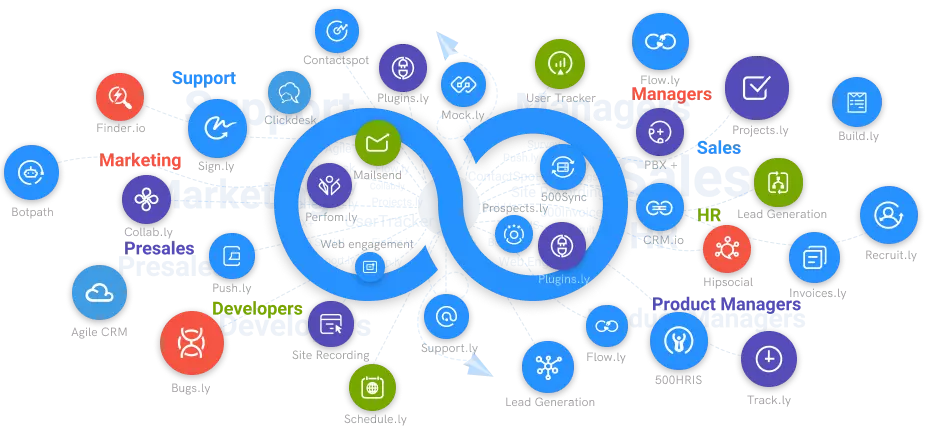
Everything your business needs - 50 apps, 24/5 support and 99.95% uptime
Consider how tough it is to balance multiple balls at the same time. If you miss a ball, the entire act is thrown out. Project management is a lot like juggling, in that you're continuously juggling between many tasks, people, projects, and other things. When a deadline is missed, the entire planning process might go awry, with catastrophic consequences.
This is why having a visual picture of a project schedule and knowing when each task is completed and who is working on it is beneficial. And it is here that Gantt chart software comes into play.
Gantt charts are visual representations of tasks plotted against time. They represent crucial information in a project, such as who is assigned to what, task durations, and overlapping activities. A Gantt chart depicts the completion of each work in a project using timelines. These timelines explain how the various tasks are connected. Gantt charts are useful because they show the activities and progress of a project.
Gantt charts show how work on a project can only begin after another task has been completed. Managers can use this data to better understand project obstacles and make key decisions about how to take a project ahead.

In its most basic form, a Gantt Chart is a timetable that depicts how the project will progress during the Project Management Process. Gantt Charts' timeline view has also proven to be quite beneficial for Project Scheduling and Planning. It assists project managers and teams in determining the length of a project, determining the resources required, understanding task dependencies, and planning the order in which each work will be accomplished if the project is to be completed on time.
Benefits of Gantt Charts
Some of the key benefits of using Gantt charts in project management software are:
1. Allows Better Tracking
Project leaders and members can use a Gantt chart to keep track of tasks, milestones, and overall workflow. The chart can show potential constraints or concerns, allowing project leaders and members to make appropriate adjustments.
2. Provides High-Level Overview
For both individuals who are directly committed and those with less involvement, such as executives and other stakeholders, a Gantt chart provides an overall perspective of a project and its timeframe.
3. Boosts Productivity
A Gantt chart enables workers to collaborate in order to increase production. A Gantt chart's great visibility helps workers keep focused on the tasks they need to finish. This transparency also ensures that all team members are held accountable for their tasks.Keep track of your project plans and teams' progress and generate detailed reports with project planning software.
4. Illustrates Overlaps and Dependencies
A Gantt chart illustrates how tasks in a project may intersect. It also demonstrates how the start of one job might be contingent on the completion of another. This type of data enables project managers to schedule work and allocate resources in a way that does not stymie project progress.
5. Manage Complex Information
A Gantt chart's visual clarity can aid in the simplification of a complex set of tasks. The chart depicts tasks in a straightforward and simple manner for those who must complete them. Team members can stay focused and avoid becoming overwhelmed by a huge number of duties because of this transparency.
6. Balance Multiple Projects
Managers can quickly track many projects using a Gantt chart. Because the chart shows how to give the proper resources at the right time, it allows those managers to balance the work on each project.

7. Set Realistic Deadlines and Expectations
A Gantt chart lists all of the tasks that must be completed by a team in order to complete a project. The diagram also depicts the linkages and dependencies between the various tasks. A realistic assessment of the time it takes to finish the work is possible with such cohesive visual communication. As a result of having such precise information, you can set reasonable timelines for each work and the overall project.
8. Motivates Team Members
A Gantt chart in project management software allows team members to visualise their duties, which helps them stay motivated to complete the project. Members of the team may see how the project is progressing and how other team members are accomplishing their roles. The diagram also shows how certain jobs can't start until another one is finished. Because of the increased visibility, workers are able to execute their responsibilities efficiently and on schedule.
9. Keeps Everyone Aligned, Including Remote Workers
All work on a project remains aligned when everyone in the team (including remote workers and those in distant offices) has simple access to the same information. Everyone benefits from the chart since it enhances communication and teamwork.
How Gantt Chart is Useful for Project Managers?
Project Managers can do the following with the help of Gantt charts:
- To improve clarity, identify all relevant tasks, think through a project plan, and better define the scope of a project.
- Determine when tasks must be done and who the predecessors and dependencies are.
- Keep your team up to date on progress and changes, and reduce the need for frequent status reports and meetings.
- Discover the critical route of a project to determine the most vital tasks that must be completed on time.
- Simplify complicated jobs by breaking them down into smaller, more digestible chunks on a visual timeline.
- Keep track of and compare planned and actual timelines, and make sure that the latter is realistic and achievable.
- Allocate resources across a project's various concurrent tasks, and assign the right people to the correct jobs.
- Assist stakeholders and team members in collaborating.
- Reduce the time it takes to set up, maintain, and communicate in both large and small initiatives.
- Identify duties that are past due and take proactive actions to avoid problems.
Conclusion
When your team is going on a project that requires multiple employees to complete a variety of project activities, you should use a Gantt chart. A Gantt chart can aid in the efficient completion of a huge project. However, there are instances when you'll want to provide a project overview with a simpler tool. A Project Timeline and a Project Calendar are two of these tools.


